Contrast Sensitivity: Lesson 1
This step-by-step tutorial teaches you how to build and run your first experimental design for measuring contrast sensitivity. More specifically, you will learn how to:
1) create the hierarchical structure of a basic experiment,
2) customize the events,
3) use variables to connect procedural and stimulus events,
4) run the experiment,
5) and visualize the results!
BASIC TASK
The aim of this experiment is to measure contrast detection threshold for a Gabor stimulus of given spatial frequency and size using a staircase method and a horizontal/vertical discrimination procedure.
Step 1: Opening the "Designer" Panel

Launch Psykinematix, and select the Designer panel by clicking on its icon in the toolbar.
Step 2: Adding an Experiment Event
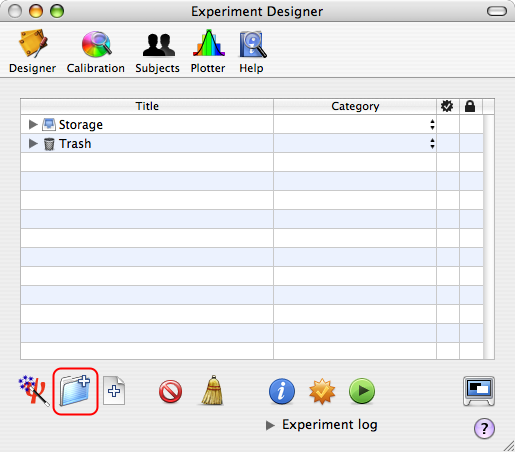
The Experiment Designer panel presents a hierarchical view of the experiments. Before going further, make sure to deselect any event by clicking on an empty row or Apple-clicking on the selected event to deselect it.
Now, create a new group event by clicking on the folder icon with the '+' symbol in the bottom toolbar.
Tip: A group event embeds one or several events.
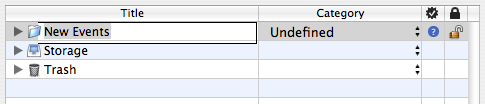
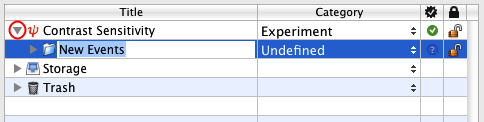
The new event appears at the top in the table with a default title (New Events). Change its title to Contrast Sensitivity to reflect the experiment purpose (double-click on the title to edit it).
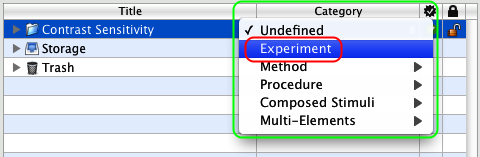
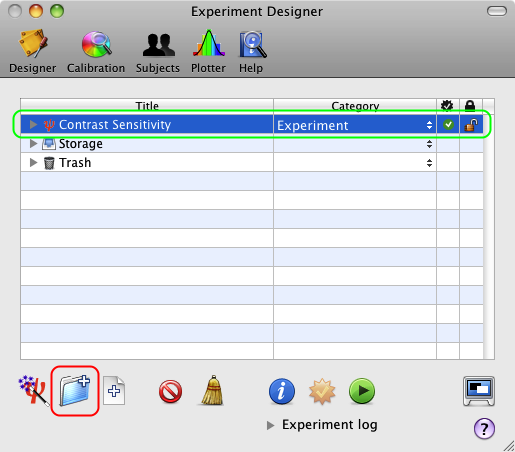
Each event is characterized by a category that defines its function inside your experimental design. To change the default category (Undefined), use the pop-up menu to select the Experiment entry. Note how the small icon in front of the event changed from a small folder to a small red psi icon specific to the Experiment event.
Tips:
Each category of events has its own small icon to depict its function.
The Undefined category can still be used to group several experiments under one roof (eg: all experiments related to the same study).
Step 3: Adding a Staircase Method
Select the Experiment event you just created (Contrast Sensitivity), and add a new group event by clicking on the '+' folder icon again.
A new Undefined event embedded in the Experiment event is automatically revealed with its title ready to be renamed.
Tip: Click on the small arrow in front of a group event to expand or collapse the first level of its hierarchical structure (option-click to reveal the whole hierarchy). The first level can be also revealed or hidden by selecting the event and pressing the space bar.
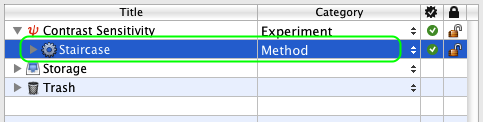
Change the title and category of the new event to Staircase and Method as illustrated.
Step 4: Adding a Discrimination Procedure
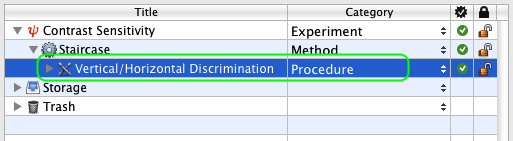
Similarly to the previous step, select the Method event, add a new group event, and change its title and category to Vertical/Horizontal Discrimination and Procedure.
Step 5: Adding a Gabor Stimulus
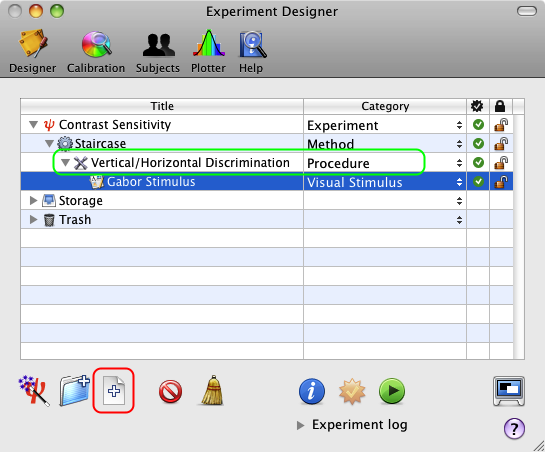
Now, select the Procedure event, and add a new leaf event by clicking on the file icon with the '+' symbol in the bottom toolbar. Change its title and category to Gabor Stimulus and Visual Stimulus as illustrated.
Tip: As atomic events, leaf events do not embed other events hence the absence of the small arrow in front of their descriptive mini-icon.
We have completed the basic hierarchical structure of the experiment, so let's move on to the customization of each event.
Step 6: Customizing the Method
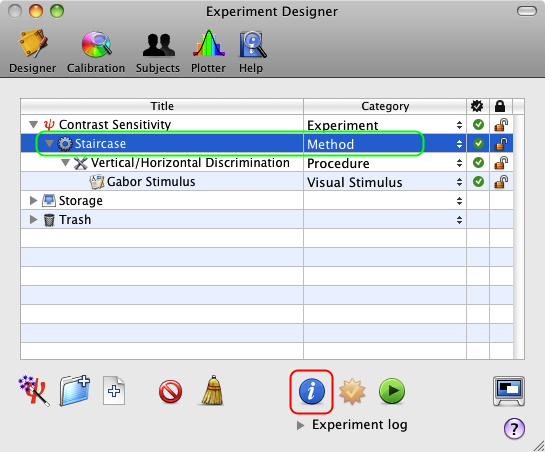
Click on the Staircase event to select it, and click on the Inspector button (or press the Apple-i keystroke) to inspect the properties of the Method.
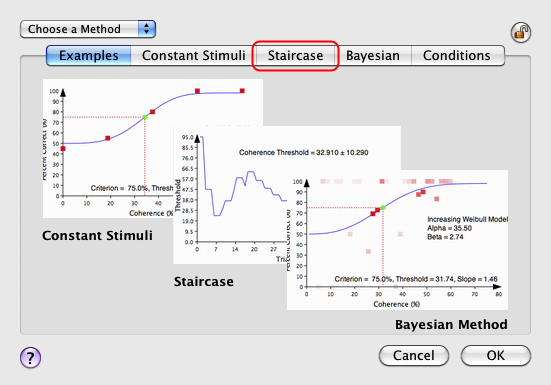
A properties page for the Method event appears with the Examples tab selected by default. Click on the Staircase tab to select the Staircase Method and view/edit its properties.
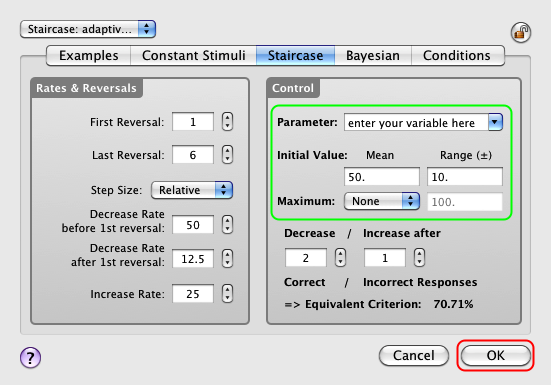
The default settings are suitable for a standard staircase method but should be customized to better fit your experimental requirements. The mandatory changes are those associated with the stimulus parameter that drives the threshold estimation during the experiment, as illustrated below with the Gabor contrast which is the dependent variable of this experimental design.
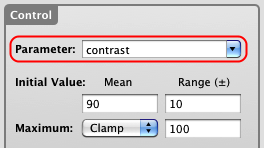
The name of the stimulus parameter and its initial value (in the range specified by a uniform distribution, mean ± deviation) need to be set appropriately. Change these values to match those of the figure: the parameter is named "contrast" and its initial value is set in the range 90 ± 10 (in %). You can also specify optionally a maximum value for the contrast (eg: 100%).
Click on the OK button on the properties page to validate these changes and return to the Designer panel.
Step 7: Customizing the Procedure
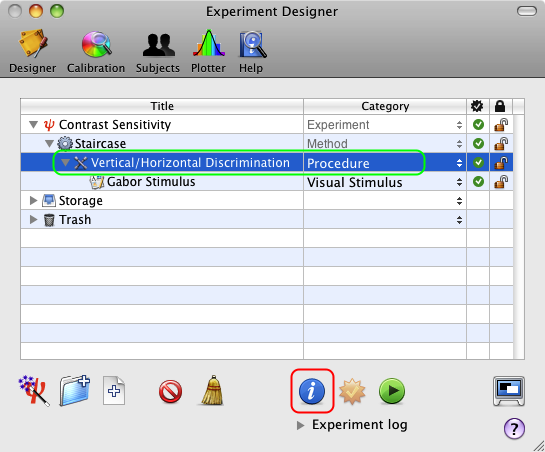
Once you have returned to the Designer panel, select the Vertical/Horizontal Discrimination Procedure event, and click on the Inspector button to inspect its properties.
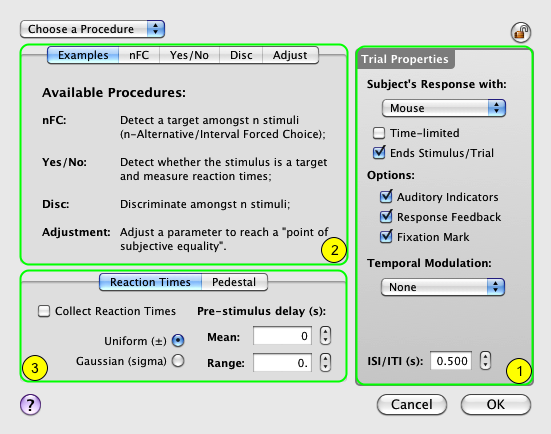
The properties page for the Procedure event consists of three sections:
1) A right side common to all procedures that specifies the properties to be applied to each trial
2) A top-left section that specifies the type of procedure (Examples tab selected by default) and its properties
3) A bottom-left section that provides more customization for some of the procedures (reaction times and pedestal)
Let's customize each of these sections:
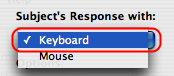
1) First, in Trial Properties change the type of inputs used by the subject to provide his/her responses: select the Keyboard device instead of the default (Mouse). The top/down arrows will be used by the subject to indicate a vertical stimulus, while the left/right arrows will indicate a horizontal stimulus.
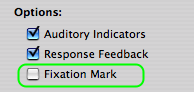
Uncheck the Fixation Mark option, so no fixation is displayed during the stimulus presentation (pre- and post-stimulus fixations may be still present). This minimizes the possibility of interference between a low contrast stimulus and the fixation.
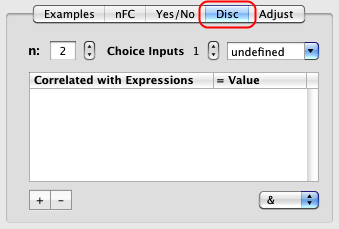
2) In the procedure-specific section of the panel, click on the Disc tab to select the discrimination procedure and view/edit its settings.
Make sure a 2AFC discrimination is specified by setting n to 2; n also corresponds to the number of inputs as there is one input for each alternative decision (vertical or horizontal) in the Discrimination Procedure.
Enter the subject response associated with each alternative decision: select the first choice index with the stepper (1 in the above figure) and enter the keyboard keys (right_arrow, left_arrow in the figure) corresponding to the horizontal decision, followed by RETURN.
Tip: Several inputs, separated by a comma, can be specified for the same decision.
Similarly, set the up_arrow, down_arrow response keys for the second choice index corresponding to the vertical decision, followed by RETURN.
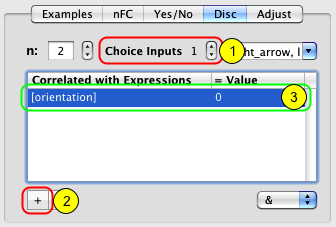
Now let's indicate explicitly the relationship between the decision and the random variable that controls the stimulus orientation. The subject is expected to provide a correct response when pressing the right or the left arrows for a horizontal stimulus (orientation of 0 deg).
To specify this:
1) select the choice input 1
2) click on the '+' button to add an expression entry in the table
3) in the "Correlated with Expression" column enter the name of the Orientation variable between brackets, and its expected value in the "= Value" column (0 deg)
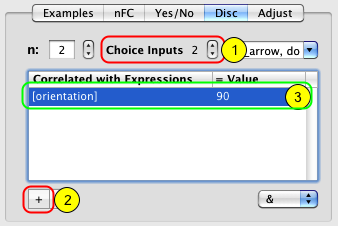
Similarly, the subject is expected to provide a correct response when pressing the up or the down arrows for a vertical stimulus (orientation of 90 deg):
1) select the choice input 2
2) click on the '+' button to add an expression entry in the table
3) in the "Correlated with Expression" column enter the name of the Orientation variable between brackets, and its expected value in the "= Value" column (90 deg)
Click on the OK button to validate the changes and return to the Designer panel.
Step 8: Customizing the Visual Stimulus
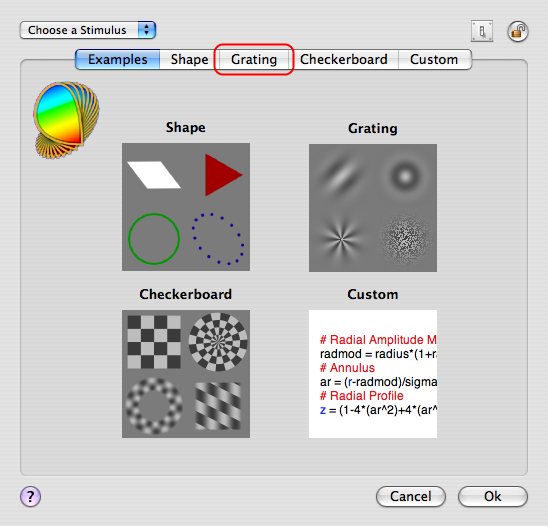
From the Designer panel, select the Gabor Visual Stimulus event, and click on the Inspector button to inspect its properties. On the properties page, click on the Grating tab to select the Grating-like Stimulus and view/edit its settings.
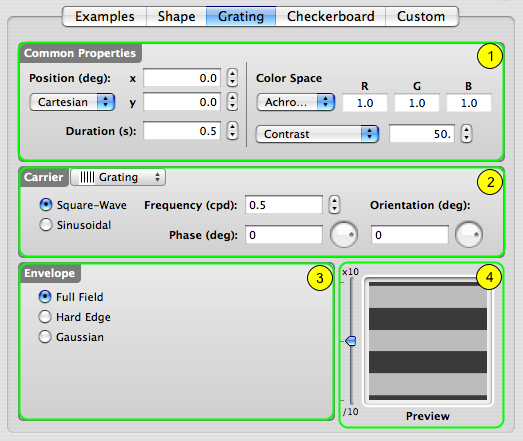
The properties page for the Visual Stimulus event consists of four sections:
1) A top section common to all types of visual stimulus that specifies their position, duration, and appearance
2) A middle section that specifies the carrier properties
3) A bottom-left section that specifies the envelope properties
4) A real-time preview in the bottom right-hand corner that can be zoomed in and out
Let's customize each of these sections:
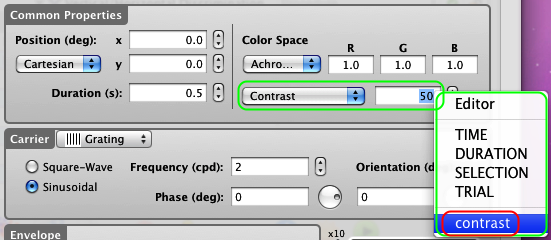
1) Connect the Stimulus Contrast to the parameter used by the Staircase Method by selecting the contrast variable that appears in the contextual menu when control-clicking on the text field, as illustrated above. Make sure to select the entire content of the text field before selecting the variable in the menu so the selection completely replaces the previous content.
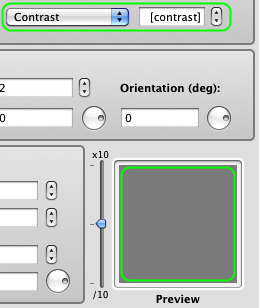
Note that once selected, the variable name appears in brackets, thus indicating that the variable is providing a value to the stimulus parameter. Note as well that the stimulus preview became blank. This is because its contrast is assigned to the variable contrast whose value will be specified by the staircase method when running the experiment. The default value for any variable is 0.
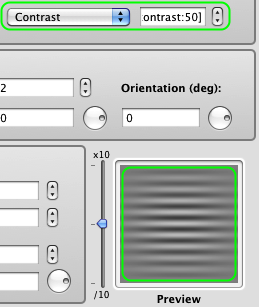
To display a preview for a variable value other than the default, add the desired value preceded by a colon before the closing bracket (eg: [contrast:50]). This value is now used but only for preview purposes and has no effect on the experimental design.
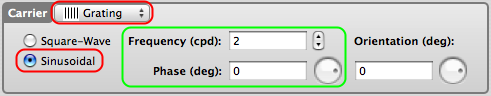
2) To create the Gabor stimulus: select the Grating type from the Carrier pop-up menu in the middle section; select Sinusoidal modulation; and set the values for the spatial frequency and phase.
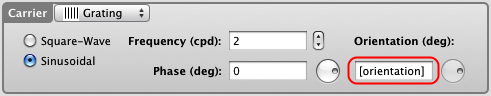
Most importantly, connect the Carrier Orientation to the parameter used by the Discrimination Procedure by entering the orientation variable in brackets.
Note: the orientation variable does not appear in the contextual menu when control-clicking on the orientation text field because it has not been declared yet (see step 9 below).
To display a preview for a value of the carrier orientation other than the default (0), add the desired value preceded by a colon before the closing bracket (eg: [orientation:90]). This value is used only for preview purposes and has no effect on the experimental design.
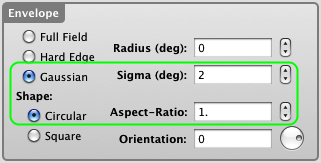
3) In the bottom-left section, select a Gaussian envelope and set the value for its sigma. Select the circular shape with an aspect-ratio of 1.
4) Note how the preview is automatically updated with your changes (use the slider to zoom the preview in and out).
We have finished with the experimental design so click on the OK button to validate the changes and return to the Designer panel.
Step 9: Customizing the Experiment
We have almost completed the experiment design. Two things remain to be done:
1) To specify the possible values taken by the orientation variable (so far we have just specify its expected values relative to the subject's discrimination task).
2) To take advantage of the bit-stealing technique to improve the measurement of the contrast thresholds.
Both can be done by customizing the Experiment properties. From the Designer panel, select the Contrast Sensitivity Experiment event, and click on the Inspector button to inspect its properties.
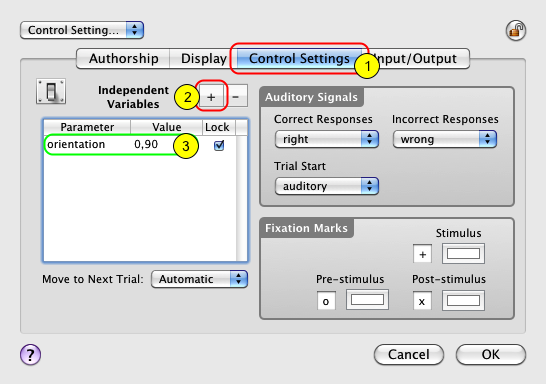
1) On the properties page, click on the Control Settings tab to view/edit the control settings, ie. those settings that affect the experimental protocol.
2) Click on the '+' button to add an entry in the Independent Variables table.
3) Edit this entry and name its parameter orientation and specify its possible values separated by a comma: 0 and 90. Each time this variable will be used to define the stimulus orientation, its value will be randomly chosen among these 2 values.
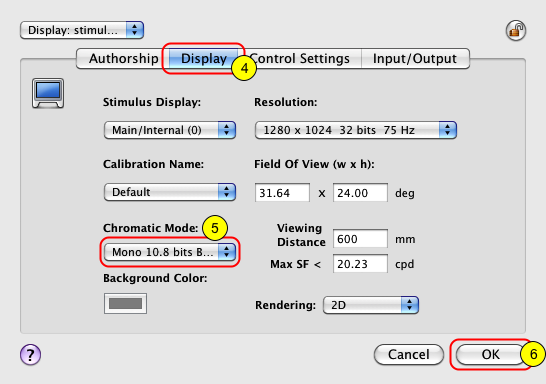
4) Click on the Display tab to view/edit the display settings, ie. those settings that affect the stimuli rendering on the experimental display.
5) Select the Mono 10.8 bits Bit-Stealing option in the Chromatic Mode pop-up menu. This indicates the use of the bit-stealing technique to improve the contrast resolution from 256 (8-bits) to 1786 (10.8-bits) gray levels (see the Defaults Preferences section of the documentation to learn more about it).
6) Click on the OK button to validate these changes and return to the Designer panel.
Step 10: Checking & Running the Experiment
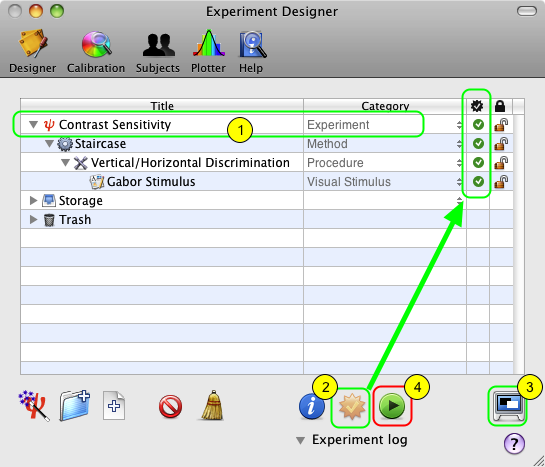
To run an experiment, simply do the following:
1) Select the Contrast Sensitivity Experiment event which is at the root of your experiment design.
2) Check the validity of your design by clicking on the Check button in the button toolbar: if correct, all the indicators in the check column turn into green check marks.
3) Toggle the experimental session between windowed or full-screen mode: the windowed mode is appropriate for testing purposes only as neither Gamma correction nor timing checks are performed during the experiment, and the session results are not saved into Psykinematix database.
4) Click on the Run button to run the experiment.
Tips:
Experiments can also be run through the Experiments menu which contains an up-to-date list of all the experiments present in the Designer panel.
If the Check button is disabled, Auto-Checking is activated so an event status is automatically updated every time the event is modified (see related option in the Preferences panel).
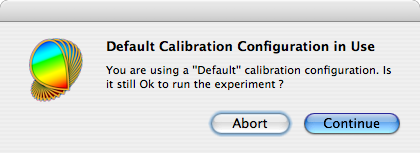
This warning message is displayed when no calibration configuration is specified for the experiment running (see the end of the Calibration Tutorial to learn how to specify a calibration configuration); however, you can still run the experiment using a default calibration by clicking on the Continue button.
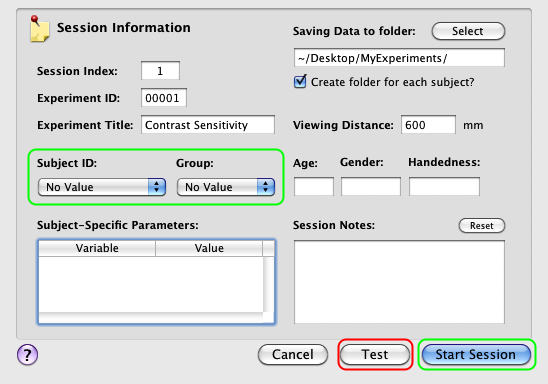
Before the session starts in full-screen mode, a panel summarizing the Session Information is displayed. You can either run the session in testing mode, which does not require the specification of the subject and group, or in real mode, if you specify them. In testing mode, no session data is actually saved in the results database.
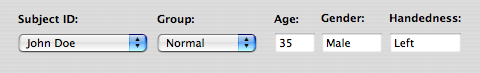
If you have already entered subjects and groups in the Subjects panel (see the Subjects Tutorial), you can select them using the two pop-up menus provided. Their age, gender, and handedness are then shown.
Click on the Start Session button.
Press ESC (escape keyboard key) to stop the session at any time.
Step 11: Visualizing the Results
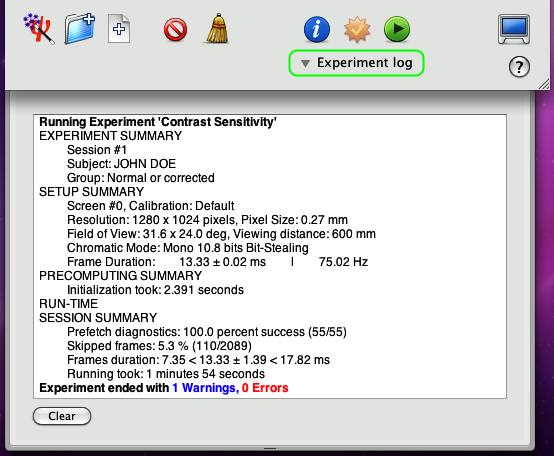
Once the session has completed normally, you are asked to press ESC to return to the Designer panel. If an error occurred during the session, a logging panel will automatically show up with relevant error and warning messages. This panel also includes a summary of the experimental conditions in terms of subject, display setup, and various other diagnostic information. If no error occurred, you can still reveal this panel by clicking on the small arrow Experiment log.
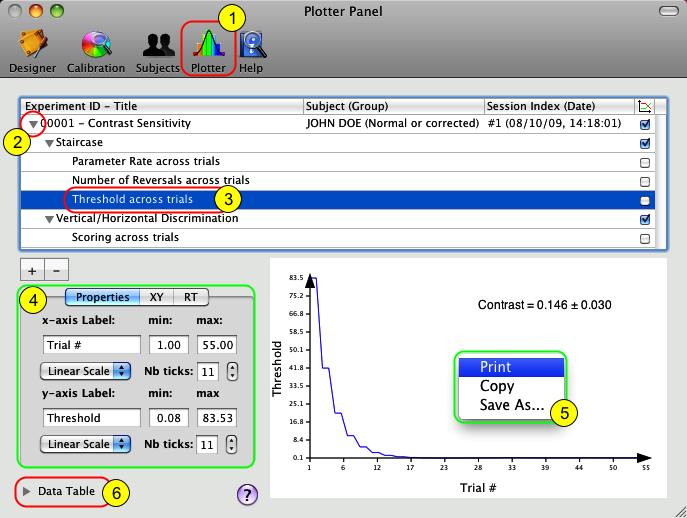
Upon termination of an experimental session, results data are created and saved in the Psykinematix database. The session data can also be visualized immediately on the Plotter panel:
1) Click on the Plotter icon in the toolbar to access the panel.
2) Option-click on the small arrow in front of the session entry to expand the whole hierarchy of the results data.
3) Select one of the entries in the final level of the hierarchy to plot its attached dataset (each entry contains a different dataset).
4) You can customize the appearance of the graph using the "Properties" tab.
5) Control-click inside the graph to print, copy, or save it to a file.
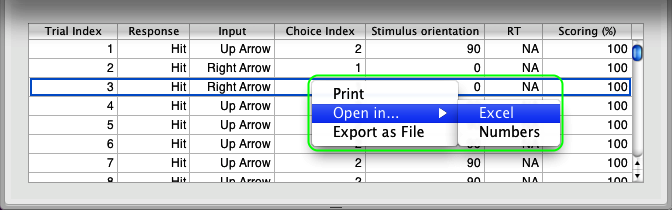
6) Click on the arrow to reveal the spreadsheet containing the selected data used to plot the graph (control-click inside the spreadsheet to print or export the data).
See the Subjects Tutorial and the Plotter Tutorial to learn how to select, import, and plot data collected during previous Psykinematix sessions.
Conclusion
In this lesson, you learned the Psykinematix basics: how to create the hierarchical structure of an experiment, how to customize the events, how to use variables to connect procedural and stimulus events, and how to run a session and inspect the results.
In the next lesson, you will learn how to interleave several staircases to investigate the effect of spatial frequency on contrast thresholds (Lesson 2). You may also consider the following lessons of the Orientation Discrimination tutorial to learn how to:
- implement a sandwich paradigm with forward and feedback masking noise (Lesson 3),
- add a spatial and temporal context (Lesson 4),
- add motion & dynamics through the use of a 1st-order drifting Gabor (Lesson 5).